13.1. Get_Rendering Commands
The source code is maintained by Anurag Upadhyay from University of Utah.
For Developers : If you are interested in developing visualization functions and contributing to Get_Rendering library, please go through Visualization Development Guide to understand the existing code. This will be helpful in reducing changes while merging the new codes. There is a dedicated branch of OpenSeesPy for developement of Get_Rendering library (https://github.com/u-anurag/OpenSeesPy). All the new code should be added to this dedicated branch, and not the main OpenSeesPy branch.
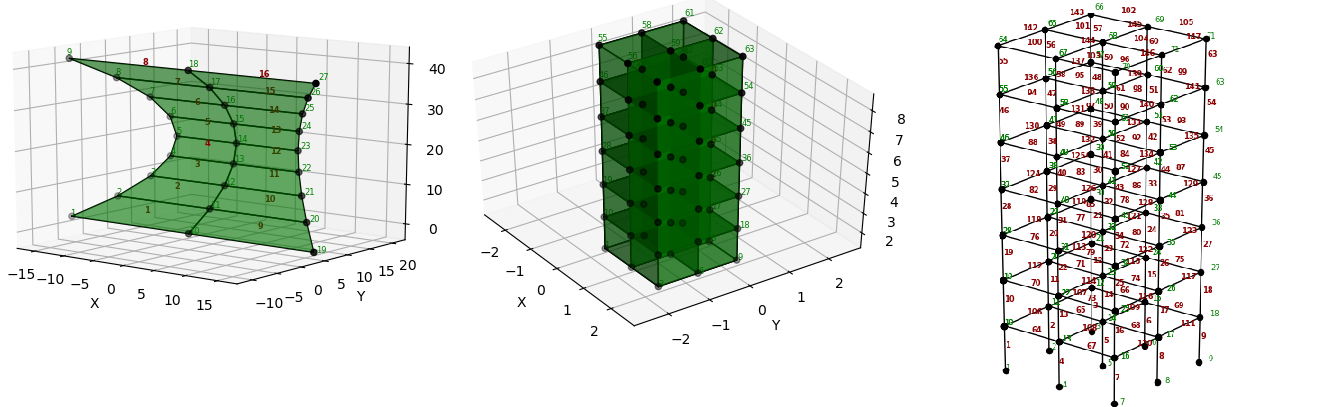
Model visualization is an ongoing development to make OpenSeesPy more user friendly. It utilizes Matplotlib 3.0 library to plot 2D and 3D models in a dedicated interactive window. You can use click-and-hold to change the view angle and zoom the plot. The model image can be saved with the desired orientation directly from the interactive plot window. If you did not install matplotlib using Anaconda, you will have to install PyQt or PySide to enable an interactive window (Matplotlib Dependencies).
Animation: To save the animation movie as .mp4 file, FFmpeg codecs are required.
When using Spyder IDE and Jupyter notebook, the default setting is to produce a static, inline plot which is not interactive. To change that, write the command %matplotlib qt in the Ipython console and then execute the model plotting commands. This will produce an interactive plot in a dedicated window.
See the example A Procedure to Render 2D or 3D OpenSees Model and Mode Shapes for a sample script.
Following elements are supported:
- 2D and 3D Beam-Column Elements
- 2D and 3D Quad Elements
- 2D and 3D Tri Elements
- 8 Node Brick Elements
- Tetrahedron Elements (to be added)
The following two commands are needed to visualize the model, as shown below:
#Change plot backend to Qt. ONLY if you are using an Ipython console (e.g. Spyder)
%matplotlib qt

#Change plot backend to 'Nbagg' if using in Jupyter notebook to get an interactive, inline plot.
%matplotlib notebook

# import OpenSeesPy rendering module
import openseespy.postprocessing.Get_Rendering as opsplt

# render the model after defining all the nodes and elements
opsplt.plot_model()

# plot mode shape
opsplt.plot_modeshape(3)
Following are commands and development guide related to model visualization:
- Create Output Database
- saveFiberData2D command
- plot_model command
- plot_modeshape command
- plot_deformedshape command
- plot_fiberResponse2D command
- animate_deformedshape command
- animate_fiberResponse2D command
- Plotting OpenSees Tcl Output
- Visualization Development Guide