14.7.2. Statics of a 2d Portal Frame (ops_vis)
Example .py file can be downloaded here:
1 2 3 4 5 6 7 8 9 10 11 12 13 14 15 16 17 18 19 20 21 22 23 24 25 26 27 28 29 30 31 32 33 34 35 36 37 38 39 40 41 42 43 44 45 46 47 48 49 50 51 52 53 54 55 56 57 58 59 60 61 62 63 64 65 66 67 68 69 70 71 72 73 74 75 76 77 78 79 80 81 82 83 84 85 86 87 88 89 90 91 92 93 94 95 96 97 98 99 100 101 102 103 104 105 | import openseespy.opensees as ops
import openseespy.postprocessing.ops_vis as opsv
# import opensees as ops # local compilation
# import ops_vis as opsv # local
import matplotlib.pyplot as plt
ops.wipe()
ops.model('basic', '-ndm', 2, '-ndf', 3)
colL, girL = 4., 6.
Acol, Agir = 2.e-3, 6.e-3
IzCol, IzGir = 1.6e-5, 5.4e-5
E = 200.e9
Ep = {1: [E, Acol, IzCol],
2: [E, Acol, IzCol],
3: [E, Agir, IzGir]}
ops.node(1, 0., 0.)
ops.node(2, 0., colL)
ops.node(3, girL, 0.)
ops.node(4, girL, colL)
ops.fix(1, 1, 1, 1)
ops.fix(3, 1, 1, 0)
ops.geomTransf('Linear', 1)
# columns
ops.element('elasticBeamColumn', 1, 1, 2, Acol, E, IzCol, 1)
ops.element('elasticBeamColumn', 2, 3, 4, Acol, E, IzCol, 1)
# girder
ops.element('elasticBeamColumn', 3, 2, 4, Agir, E, IzGir, 1)
Px = 2.e+3
Wy = -10.e+3
Wx = 0.
Ew = {3: ['-beamUniform', Wy, Wx]}
ops.timeSeries('Constant', 1)
ops.pattern('Plain', 1, 1)
ops.load(2, Px, 0., 0.)
for etag in Ew:
ops.eleLoad('-ele', etag, '-type', Ew[etag][0], Ew[etag][1],
Ew[etag][2])
ops.constraints('Transformation')
ops.numberer('RCM')
ops.system('BandGeneral')
ops.test('NormDispIncr', 1.0e-6, 6, 2)
ops.algorithm('Linear')
ops.integrator('LoadControl', 1)
ops.analysis('Static')
ops.analyze(1)
ops.printModel()
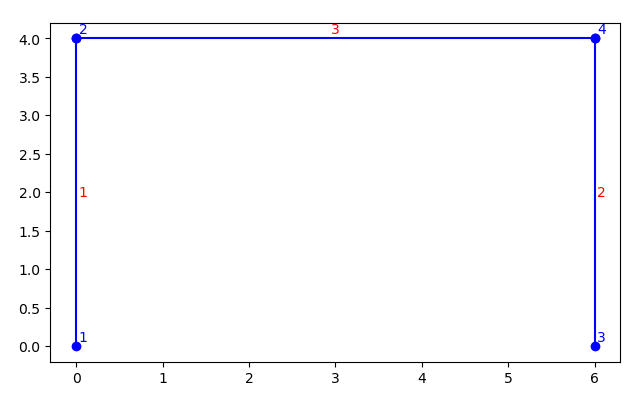
# 1. plot model with tag lebels
szer, wys = 16., 10.
fig = plt.figure(figsize=(szer/2.54, wys/2.54))
fig.subplots_adjust(left=.08, bottom=.08, right=.985, top=.94)
ax1 = plt.subplot(111)
opsv.plot_model()
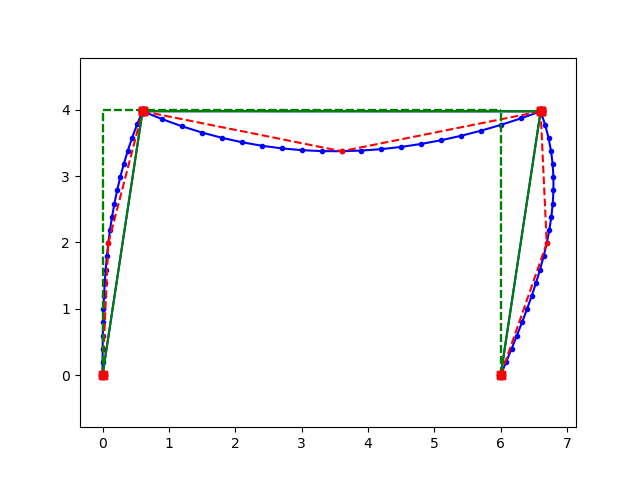
# 2. plot deformed model
sfac = 80.
plt.figure()
# plot_defo with optional arguments
# sfac = opsv.plot_defo()
opsv.plot_defo(sfac, fmt_interp='b.-')
opsv.plot_defo(sfac, 5, interpFlag=0, fmt_nodes='bo-')
opsv.plot_defo(sfac, 3, endDispFlag=0, fmt_interp='r.--')
opsv.plot_defo(sfac, 2, fmt_interp='g.-')
# print(f'sfac: {sfac}') # return sfac if automatically calculated
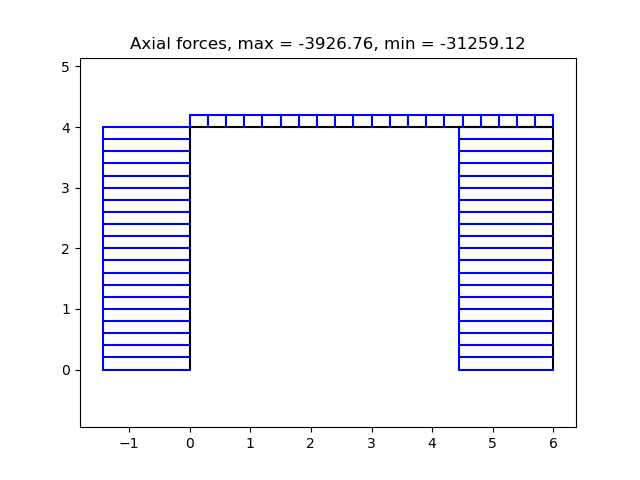
# 3. plot N, V, M forces diagrams
sfacN, sfacV, sfacM = 5.e-5, 5.e-5, 5.e-5
plt.figure()
minVal, maxVal = opsv.section_force_diagram_2d('N', Ew, sfacN)
plt.title(f'Axial forces, max = {maxVal:.2f}, min = {minVal:.2f}')
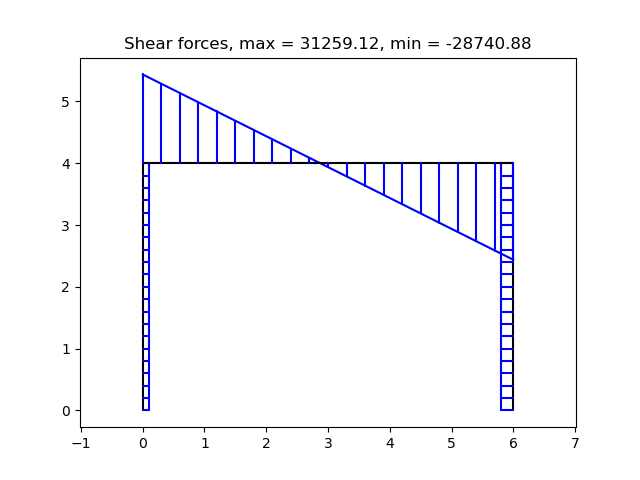
plt.figure()
minVal, maxVal = opsv.section_force_diagram_2d('T', Ew, sfacV)
plt.title(f'Shear forces, max = {maxVal:.2f}, min = {minVal:.2f}')
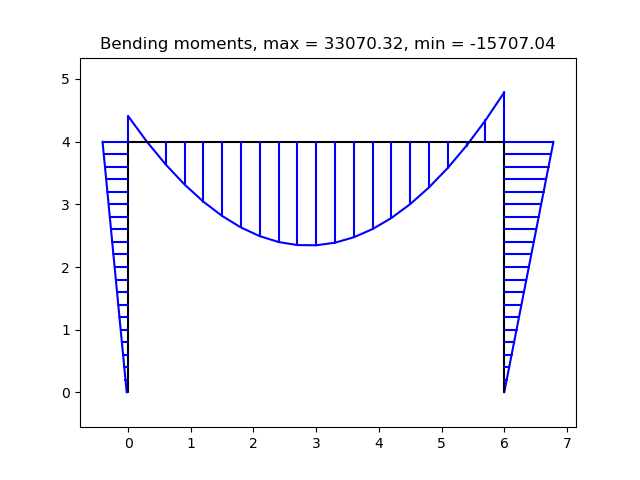
plt.figure()
minVal, maxVal = opsv.section_force_diagram_2d('M', Ew, sfacM)
plt.title(f'Bending moments, max = {maxVal:.2f}, min = {minVal:.2f}')
plt.show()
exit()
|